improved
July 2021
Block Trackers on your browsers
You can now block e-commerce websites, social media websites, and any other website that uses different techniques to track users’ activities online. With the new
Trackers
category you can easily block these with a click of a button! 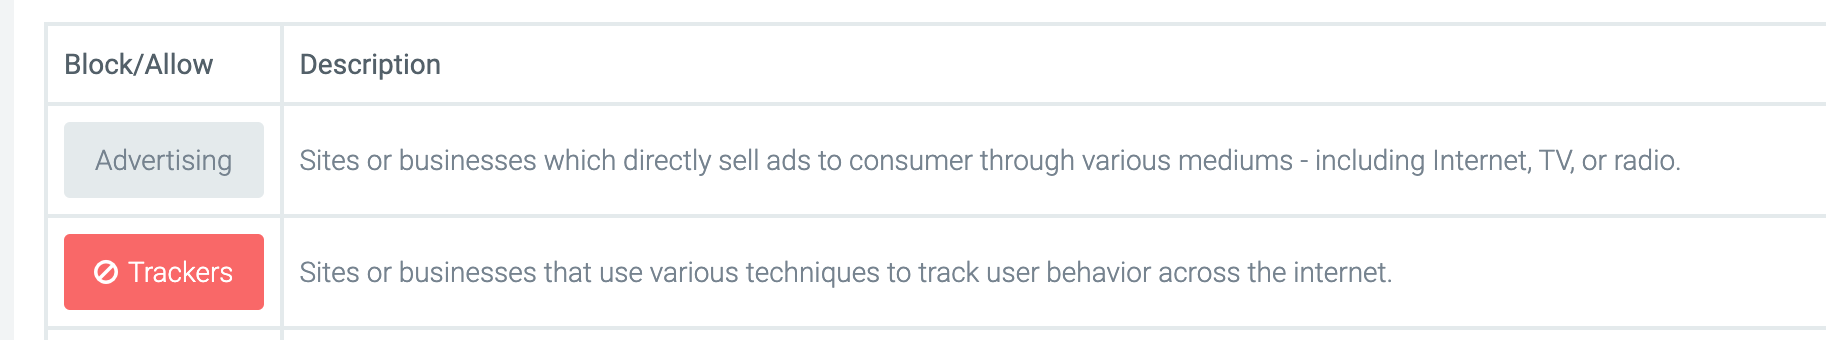
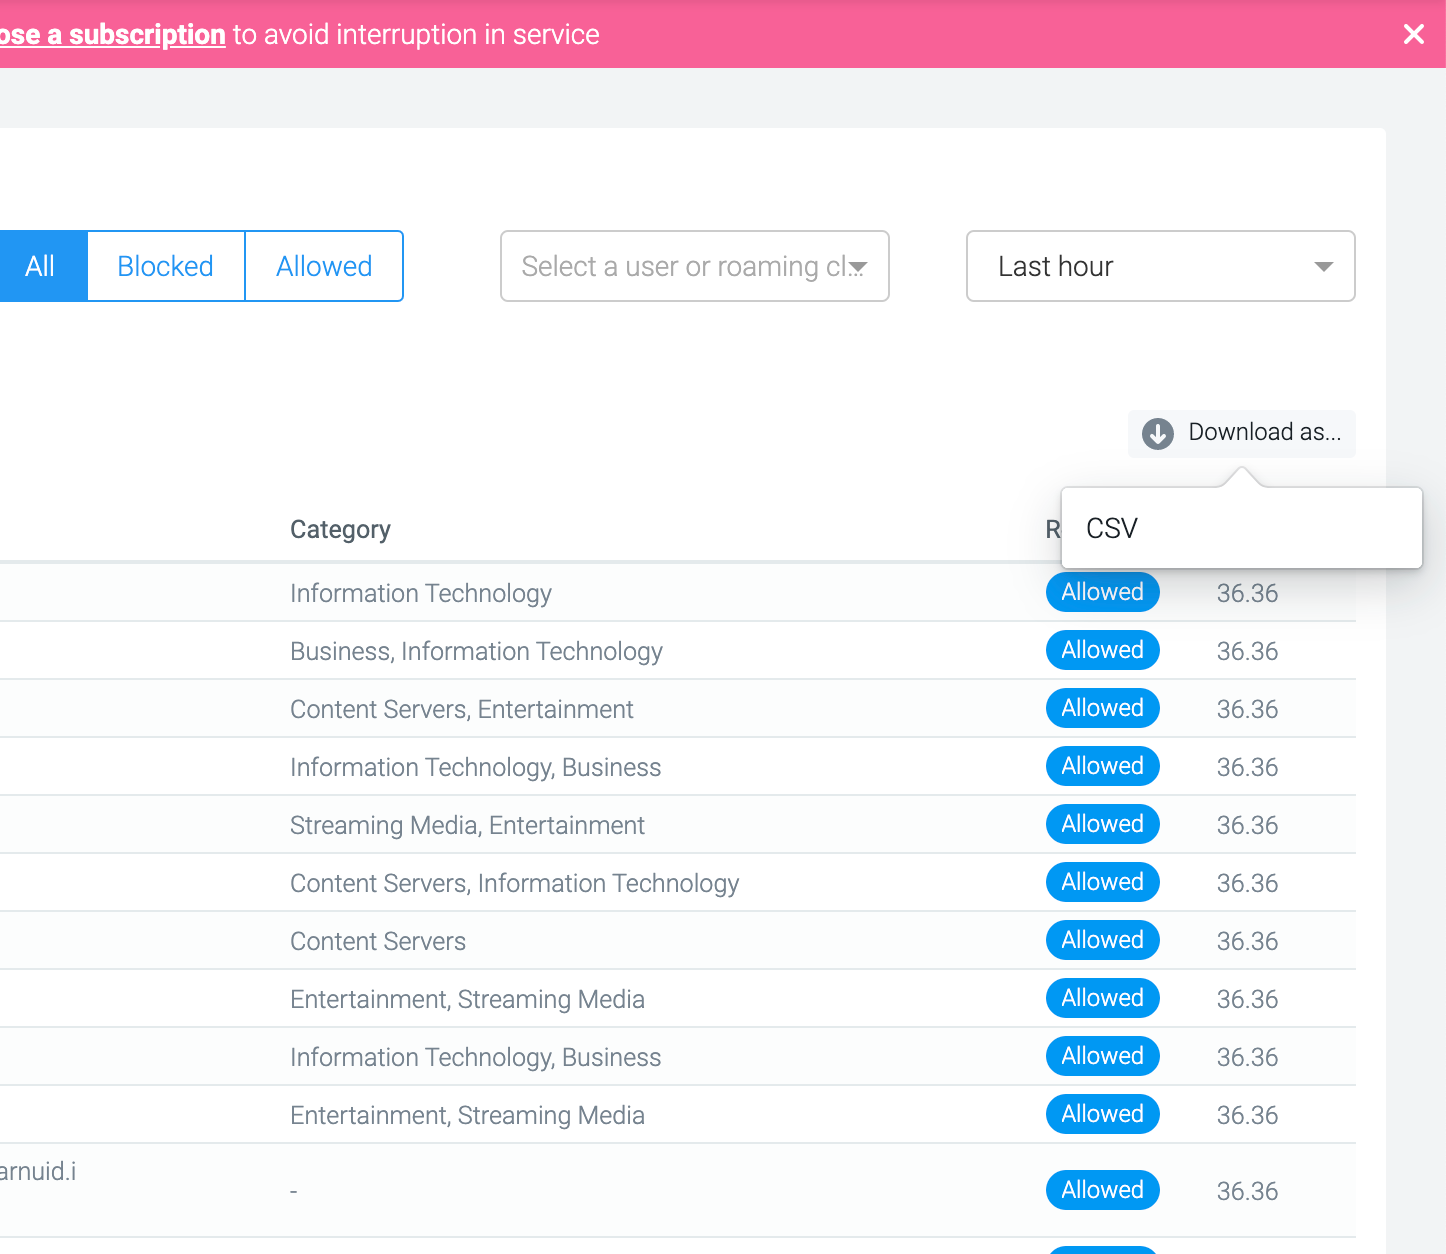
Export your DNS Query Logs in CSV format
We noticed that you have been having issues using the CSV export functionality to export your query logs. We have fixed this issue, and you can now successfully export your query logs in CSV format.
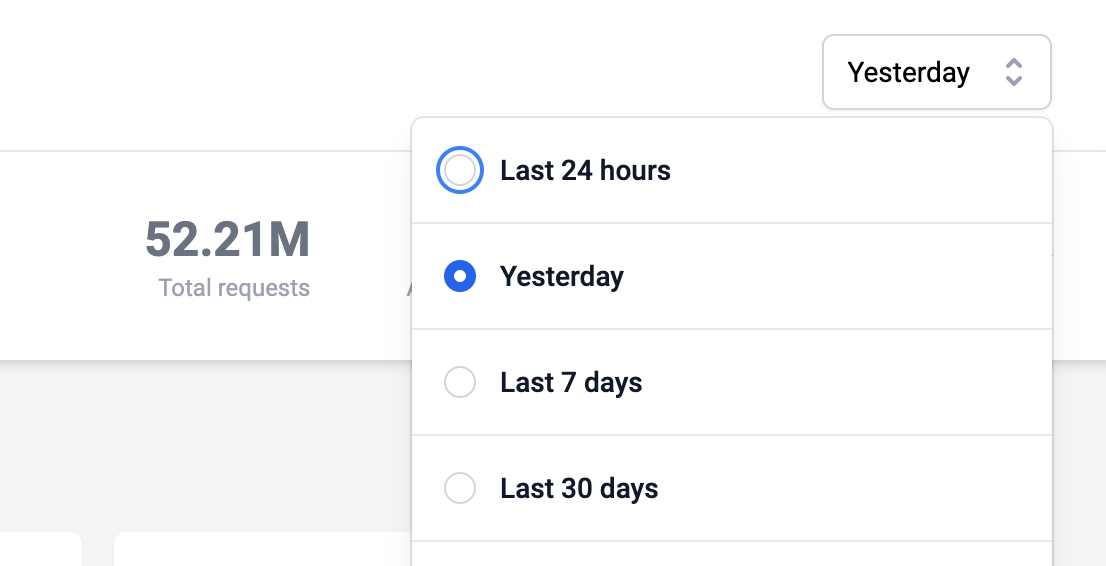
View Insights Reporting over the last 24hours
We have switched the “Today” filter on the Insights Reporting page to “Last 24 hours”. This new filter option allows you to query reports of activities that have taken place within the last 24hours to when you’re visiting the Insights page. We believe that this better reflects the most current daily information coverage you would like to access.
A bug was also noticed on the time series “Request over time” report. The reporting starts a day earlier than when the customer started using the service. This has been fixed.
Get full domain reports from your Insights page with Clickable domains
You can now click on a domain on the Insights page to view the report of its subdomains. Before now, you could see all domains (subdomains included) for a specific Roaming client, Category, User, or Collection but not for a specific domain. With clickable domains, you can now click on a domain and see all subdomains related to that call.
MSPs would need to select an organization first to enable clickable domains, regular users do not have to do this.
Other news
- The Total expected user countselection list on the trial signup form has been updated with new ranges (1 - 50, 1000 - 5000, and 5000+).
- The help message on Roaming Client installation options for Whitelabel domains no longer contains the part that references DNSFilter.
- We noticed some inconsistencies in the summary metrics on the Overview and Reporting pages. This has been fixed.
- The 404error encountered when switching to an organization’s profile from its MSP page has now been fixed. The organization’s profile displays as expected.
- The Lan Subnetstab on theRelayspage displaying incorrect IP addresses for theFrom/Tocolumns and edit form has been fixed to display the correct values.
- The graph for the Last 24 hoursfilter option on the Insights page now displays data points at every 15-minute interval.
- Error messages for the Lan subnetform on the Relays page now display underneath their respective form fields. This is an improvement on the previous error display which displays on the top-right corner of the screen with no context regarding where the error occurred.